Network infrastructure has become the backbone of modern business operations. When systems go down or performance degrades, IT teams need to pinpoint problems fast. A well-constructed network map transforms hours of troubleshooting into minutes by providing a visual reference of every connection, device, and dependency in your environment.
What Is a Network Map and Why You Need One
A network map is a visual representation of your IT infrastructure showing how devices, servers, routers, switches, and endpoints connect and communicate. While the terms are often used interchangeably, network maps typically emphasize geographic or physical layout, whereas network diagrams focus more on logical relationships and data flow patterns.
IT teams rely on these visualizations for multiple critical functions. During outages, a current map helps technicians trace signal paths and identify failure points without physically inspecting every cable. When planning upgrades, network administrators use maps to calculate bandwidth requirements and spot bottlenecks before purchasing new equipment. Security audits become more thorough when analysts can see every entry point and data pathway in a single view.
Businesses benefit beyond the IT department. Facility managers use network maps when planning office renovations to avoid cutting critical cables. Compliance officers reference them during audits to demonstrate proper network segmentation. New team members get up to speed faster when they can study infrastructure layout before touching production systems.
The documentation gap is real. Small companies often skip mapping entirely until a crisis forces the issue. Mid-sized organizations might have outdated diagrams created years ago by staff who have since moved on. Even large enterprises struggle to keep maps synchronized with their actual production environments as changes accumulate.
The first thing I do when joining a new organization is request their network documentation.If they don't have current maps, I know I'm spending my first month reverse-engineering their infrastructure instead of improving it. Accurate documentation isn't optional—it's the foundation of everything we do
— Marcus Chen
Types of Network Maps You Can Create
Network visualization serves different purposes depending on what you need to communicate. Choosing the right map type prevents confusion and ensures your diagram answers the questions people actually ask.
Physical network maps show the real-world location of hardware. These diagrams indicate which server sits in which rack, how cables run between buildings, and where wireless access points mount on walls. Facilities teams and field technicians rely on physical maps when installing equipment or tracing cable runs through ceiling spaces. If you need to know that the core switch lives in Building C, third floor, northwest corner, you want a physical map.
Logical network maps ignore physical location and focus on how data moves through your infrastructure. These diagrams show IP subnets, VLAN configurations, routing protocols, and firewall rules. A server in Tokyo and a workstation in New York might appear side-by-side on a logical map if they're on the same VLAN. Network engineers use logical maps for troubleshooting connectivity issues and planning traffic flows.
Network topology describes the pattern of connections between nodes. Star topology connects all devices to a central hub or switch—the most common pattern in modern office networks. When the switch fails, the entire segment goes down, but troubleshooting is straightforward. Mesh topology creates multiple paths between devices, providing redundancy at the cost of complexity. Large data centers often use partial mesh designs where critical systems have backup routes but edge devices don't. Hybrid topology combines patterns—star topology within departments connected via a mesh backbone, for example.
Your organization likely needs multiple map types. A complete documentation set might include a physical map showing data center rack layouts, a logical map displaying subnet architecture, and a simplified overview diagram for executives who just want to understand the big picture.
Author: Trevor Langford;
Source: milkandchocolate.net
Tools and Software for Creating Network Diagrams Online
The network diagramming market has matured significantly, offering options from free browser-based tools to enterprise platforms costing thousands annually. Your choice depends on team size, required features, and whether you need automated discovery or manual drawing.
Tool
Pricing
Ease of Use
Collaboration
Template Library
Export Formats
Draw.io (diagrams.net)
Free
Moderate
File-based sharing
50+ network templates
PNG, SVG, PDF, XML
Lucidchart
$7.95–$9/user/month
High
Real-time editing
100+ templates
PNG, JPG, PDF, Visio
Microsoft Visio
$5–$15/user/month
Moderate
SharePoint integration
70+ templates
PNG, PDF, SVG, Visio
Creately
$5–$8/user/month
High
Real-time editing
1000+ templates (all types)
PNG, SVG, PDF, Visio
NetBrain
Custom enterprise pricing
Low (powerful but complex)
Team workspaces
Auto-generated from network
PDF, Visio, proprietary
Draw.io (now diagrams.net) appeals to budget-conscious teams and individual administrators. The browser-based interface requires no installation, and files save to Google Drive, OneDrive, or your local system. The learning curve is steeper than commercial alternatives, but you're not locked into subscription payments. The lack of real-time collaboration means teams pass files back and forth rather than editing simultaneously.
Lucidchart dominates the mid-market with its polished interface and smooth collaboration features. Multiple team members can edit the same diagram simultaneously, seeing each other's cursors and changes in real time. The template library covers common network scenarios, letting you start with a three-tier architecture or cloud VPC design rather than a blank canvas. Integrations with Confluence, Slack, and Microsoft Teams fit naturally into existing workflows.
Microsoft Visio remains the enterprise standard, particularly in organizations already using Microsoft 365. Desktop and web versions share file formats, and SharePoint integration provides version control without third-party tools. The symbol libraries are comprehensive, though the interface feels dated compared to newer competitors. Plan 1 offers basic diagramming while Plan 2 adds data linking and automated diagram generation from Excel spreadsheets.
Creately positions itself between Draw.io's free tier and Lucidchart's premium pricing. The infinite canvas approach lets you create multiple related diagrams in a single workspace, useful when documenting both physical and logical views of the same infrastructure. Video collaboration features let remote teams discuss diagrams while seeing each other's faces.
NetBrain and similar enterprise platforms (SolarWinds Network Topology Mapper, ManageEngine OpManager) automatically discover and map your network by crawling SNMP data, routing tables, and switch configurations. These tools excel in large, complex environments where manual mapping would take weeks. The trade-off is cost and complexity—expect lengthy implementations and dedicated training.
Cloud-based tools offer anywhere access and automatic updates but require internet connectivity and raise data security questions. Desktop software provides offline access and keeps sensitive network data on your systems but complicates team collaboration. Hybrid approaches like Visio's desktop/web combination split the difference.
Author: Trevor Langford;
Source: milkandchocolate.net
How to Create a Network Diagram Step by Step
Building an effective network map requires more than dragging icons onto a canvas. Proper planning and consistent methodology ensure your diagram remains useful as your network evolves.
Planning Your Network Map
Start by defining your audience and purpose. A diagram for help desk staff troubleshooting printer connections needs different detail than one for security auditors reviewing segmentation. Write down three specific questions your map should answer—this focus prevents scope creep and keeps the diagram readable.
Gather source material before opening your diagramming tool. Collect switch configuration files, IP address spreadsheets, rack elevation diagrams, and any existing documentation. Walk the data center or network closets with a notepad, photographing equipment labels and cable tags. For larger networks, export device inventories from your monitoring system or configuration management database.
Decide your scope boundaries. Will you map the entire organization or just the headquarters office? Include cloud services and SaaS applications or only on-premises equipment? Document these decisions so future maintainers understand what's intentionally excluded versus accidentally forgotten.
Choose your detail level. High-level overview diagrams show major sites and connections but omit individual access switches. Detailed diagrams might show every VLAN and port assignment. Most organizations need both—an executive summary view and detailed technical references. Trying to fit everything into one diagram creates unusable clutter.
Choosing Symbols and Notation Standards
Consistent iconography makes diagrams instantly readable by anyone familiar with networking conventions. The IEEE and Cisco have published standard symbol sets that most professionals recognize. Routers appear as cylinders with arrows, switches as rectangles with connection points, firewalls as brick walls, and cloud services as, well, clouds.
Resist the temptation to use cutesy custom icons. That server icon shaped like R2-D2 might seem fun, but it confuses new team members and looks unprofessional in audit documentation. Stick with conventional symbols unless you have a compelling reason to deviate.
Color coding adds information density without cluttering labels. One common scheme uses green for production systems, yellow for staging, and red for security devices. Another approach color-codes by function: blue for user networks, orange for server networks, purple for management interfaces. Document your color scheme in a legend—never assume it's self-explanatory.
Label everything with meaningful names. "Core-Switch-Bldg3-FL2" conveys more than "Switch-17." Include IP addresses on routers and critical servers. Add bandwidth specifications on WAN links. The right amount of labeling makes the diagram self-documenting; too much turns it into alphabet soup.
Building the Diagram
Open your chosen tool and select an appropriate template or start with a blank canvas. Place your most critical components first—typically the internet connection, firewall, and core switches. These anchor points establish the diagram's structure.
Work outward from the core in logical layers. Position internet-facing systems at the top, core infrastructure in the middle, and end-user devices toward the bottom. This top-to-bottom flow matches how most people conceptualize network traffic moving from external sources through security layers to internal systems.
Use alignment and spacing to imply relationships. Devices in the same subnet should cluster together. Redundant pairs should sit side-by-side. Maintain consistent spacing between elements—most tools offer snap-to-grid features that prevent sloppy layouts.
Connect devices with lines representing physical cables or logical connections, depending on your map type. Use line styles to distinguish connection types: solid lines for wired Ethernet, dashed lines for wireless, thick lines for high-bandwidth trunk links. Arrow direction can indicate traffic flow in logical diagrams.
Group related components into containers or zones. Draw boxes around DMZ systems, separate production from development networks, or highlight PCI-compliant segments. These visual boundaries help viewers understand security domains and trust relationships.
Reviewing and Updating Your Map
Step away from your completed diagram for a day, then review with fresh eyes. Better yet, show it to a colleague unfamiliar with your network and ask them to explain what they see. If they misinterpret major elements, your diagram needs clarification.
Verify accuracy by comparing your diagram against real-world configuration. Pick three random connections shown on your map and confirm they actually exist in switch configs or cable documentation. This spot-check catches mistakes before they propagate into troubleshooting efforts.
Establish an update schedule before you file the diagram away. Networks change constantly—new servers deploy, old equipment retires, VLANs get reconfigured. Set a quarterly review calendar reminder to verify the map matches reality. Better yet, make map updates part of your change management process. No configuration change gets approved until someone confirms the documentation will be updated.
Version control prevents confusion about which diagram is current. Name files with dates (Network-Map-2026-03-15.pdf) or use formal version numbers. Cloud-based tools often handle versioning automatically, but file-based workflows need manual discipline. Keep at least three previous versions archived in case you need to reference historical configurations.
Author: Trevor Langford;
Source: milkandchocolate.net
Common Mistakes When Creating Network Maps
New network mappers often create diagrams that look impressive but fail in practical use. Avoiding these pitfalls saves time and frustration.
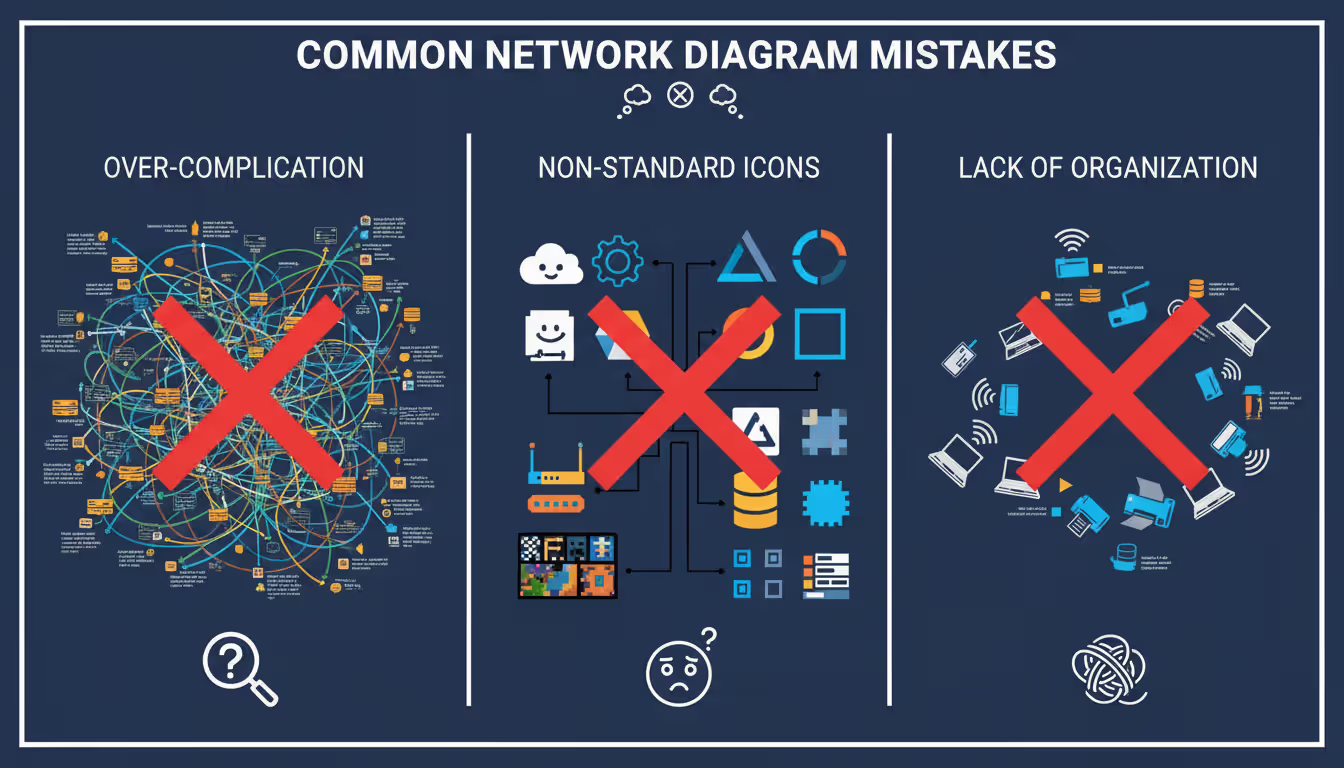
Over-complicating layouts is the most frequent error. Trying to show every single port on a 48-port switch creates visual noise that obscures important information. Summarize edge access switches as single icons unless port-level detail is specifically required. Use separate detailed diagrams for complex subsystems rather than cramming everything into one mega-diagram.
Ignoring standards creates confusion when sharing diagrams across teams or organizations. Inventing your own symbol for a load balancer might make sense to you, but it baffles everyone else. Using non-standard colors or unconventional layouts forces viewers to decode your personal system instead of focusing on the network itself.
Forgetting to update documentation is perhaps the most damaging mistake. An outdated diagram is worse than no diagram—it actively misleads troubleshooting efforts and can cause outages when technicians make changes based on incorrect information. If you can't commit to maintaining a diagram, don't create it in the first place.
Poor labeling renders diagrams nearly useless. Generic names like "Server1" and "Router2" provide no context. Missing IP addresses force viewers to consult separate documentation. Unlabeled connections leave people guessing about bandwidth or connection types. Every element should answer the question "what is this and why does it matter?"
Inconsistent detail levels create confusion. When some areas show individual patch cables while others summarize entire departments as single icons, viewers can't tell what's genuinely simple versus what's been abstracted. Maintain consistent granularity throughout a single diagram.
Security oversights happen when diagrams include too much sensitive information. Publishing detailed network maps with IP addresses, security appliance configurations, and authentication systems to company-wide wikis hands attackers a roadmap. Maintain detailed versions with restricted access and simplified versions for general distribution.
Best Practices for Network Mapping
Professional network documentation follows principles that maximize utility while minimizing maintenance burden.
Create layered documentation with multiple diagrams at different abstraction levels. A one-page overview shows sites and major connections. Mid-level diagrams detail each site's internal structure. Deep-dive diagrams document specific subsystems like storage networks or voice infrastructure. This pyramid approach lets viewers drill down to the detail they need without wading through irrelevant information.
Implement version control using tools designed for the purpose. Git repositories work well for text-based diagram formats like Draw.io XML files. SharePoint or Confluence provide version history for uploaded files. Cloud diagramming platforms often include built-in versioning. Whatever system you choose, make sure you can answer "what did our network look like six months ago?"
Enable team collaboration by choosing tools that support simultaneous editing and commenting. Network documentation should be a team effort, not one person's private knowledge. Multiple perspectives catch errors and ensure diagrams reflect actual implementation rather than one person's assumptions.
Integrate with change management processes to keep maps current. When someone submits a change request to add a new VLAN, the approval workflow should include updating relevant diagrams. This integration prevents documentation drift without requiring dedicated update sessions.
Consider security and access control carefully. Detailed network maps are sensitive documents that shouldn't be publicly accessible. Use role-based permissions to limit full diagram access to network administrators and security staff. Create sanitized versions with less detail for wider distribution.
Link diagrams to other documentation like configuration files, runbooks, and asset inventories. Many modern tools support hyperlinking—click a router icon to open its configuration file or monitoring dashboard. These connections transform static diagrams into living documentation hubs.
Test your documentation by using it during actual troubleshooting or change implementation. If your team consistently needs to consult other sources because the diagram lacks critical information, update it. Documentation that doesn't get used is documentation that isn't useful.
Automate where practical using network discovery tools to generate initial maps or verify manual diagrams against reality. Automation can't replace human judgment about what to emphasize and how to organize information, but it can catch discrepancies between documentation and actual configuration.
Frequently Asked Questions
What's the difference between a network map and a network diagram?
The terms are often used interchangeably, but network maps typically emphasize physical location and geographic layout—showing which equipment sits in which building or rack. Network diagrams focus more on logical relationships, data flow, and connectivity patterns regardless of physical location. In practice, most organizations need both types to fully document their infrastructure.
Can I create a network map for free?
Yes. Draw.io (diagrams.net) provides full-featured network diagramming at no cost, with files stored in your Google Drive, OneDrive, or locally. The tool includes standard network symbols and export options. The trade-off is a steeper learning curve and lack of real-time collaboration compared to paid alternatives. For small networks or individual administrators, free tools are entirely adequate.
What symbols should I use in a network diagram?
Stick with industry-standard symbols from IEEE or Cisco documentation. Routers appear as cylinders with directional arrows, switches as rectangles with connection indicators, firewalls as brick walls, and servers as tower or rack-mount rectangles. Cloud services use cloud shapes, and wireless access points show radio waves. Most diagramming tools include standard symbol libraries—use them rather than inventing custom icons.
How often should I update my network map?
Update your map whenever you make significant infrastructure changes—adding sites, deploying major equipment, or reconfiguring network architecture. Schedule quarterly reviews to catch minor changes and verify accuracy. Best practice integrates map updates into your change management process so documentation happens automatically as part of approved changes rather than as a separate task.
Do I need special software to create a network diagram?
Basic diagrams can be created in general-purpose tools like PowerPoint or Google Drawings, but dedicated network diagramming software provides symbol libraries, connection tools, and formatting options that dramatically speed the process. Free options like Draw.io offer these features without cost. For large or complex networks, automated discovery tools can generate initial maps from actual device configurations.
What information should be included in a network map?
Include device names, IP addresses, connection types, and bandwidth specifications. Show security zones and trust boundaries. Label critical paths and redundant connections. Add a legend explaining symbols and color coding. Include creation date and version number. Omit overly sensitive details like passwords or detailed firewall rules from widely distributed versions. The right level of detail depends on your audience—executives need less than network engineers.
A well-maintained network map transforms infrastructure from a black box into a manageable system. Whether you're troubleshooting an outage at 3 AM, planning a major upgrade, or onboarding new team members, current documentation makes the difference between guessing and knowing.
Start simple. Map your core infrastructure first, using free tools if budget is tight. Establish update processes before your diagram becomes outdated. Choose standards over creativity, and clarity over comprehensiveness. As your documentation matures, add detail layers and integrate with broader IT processes.
The network you can visualize is the network you can manage. Every hour invested in creating and maintaining accurate maps returns dividends in faster troubleshooting, better planning, and reduced downtime. Your future self—and your entire IT team—will thank you for the effort.
Every network device carries a unique MAC address identifier. This guide shows you how to find MAC addresses using command-line tools, system settings, and vendor lookup databases. Includes step-by-step instructions for Windows Command Prompt, macOS, Linux, and mobile devices
Migrating to the cloud doesn't always require reimagining your entire infrastructure. Lift and shift migration moves applications to the cloud with minimal modifications—a pragmatic approach for organizations facing data center deadlines or managing legacy systems
Network failures don't announce themselves politely. For small and medium businesses, disruptions translate directly into lost revenue and damaged reputation. This guide explains IT network support services, when you need professional help, and how to choose between in-house teams and managed providers
Building your own cloud storage gives you complete control over your data while potentially saving money compared to subscription services. This comprehensive guide covers hardware requirements, software platforms like Nextcloud, step-by-step installation, security best practices, and common mistakes to avoid
The content on this website is provided for general informational purposes only. It is intended to offer insights, commentary, and analysis on cloud computing, network infrastructure, cybersecurity, and IT solutions, and should not be considered professional, technical, or legal advice.
All information, articles, and materials presented on this website are for general informational purposes only. Technologies, standards, and best practices may vary depending on specific environments and may change over time. The application of any technical concepts depends on individual systems, configurations, and requirements.
This website is not responsible for any errors or omissions in the content, or for any actions taken based on the information provided. Users are encouraged to seek qualified professional advice tailored to their specific IT infrastructure, security, and business needs before making decisions.