Wide area network operations center with large wall displays showing network maps, performance graphs and connection status indicators between multiple cities
Your Seattle headquarters hums along perfectly. But your Dallas branch? Users there complain that the CRM loads like molasses. Your Atlanta distribution center can't sync inventory fast enough during peak hours. When you're managing networks that span states or continents, you're not just dealing with cables and routers anymore—you're wrestling with carrier handoffs, unpredictable internet routing, and the physics of moving data thousands of miles.
Here's what separates companies that stumble through network problems from those that see them coming.
What Is Wide Area Network Monitoring and Why It Matters
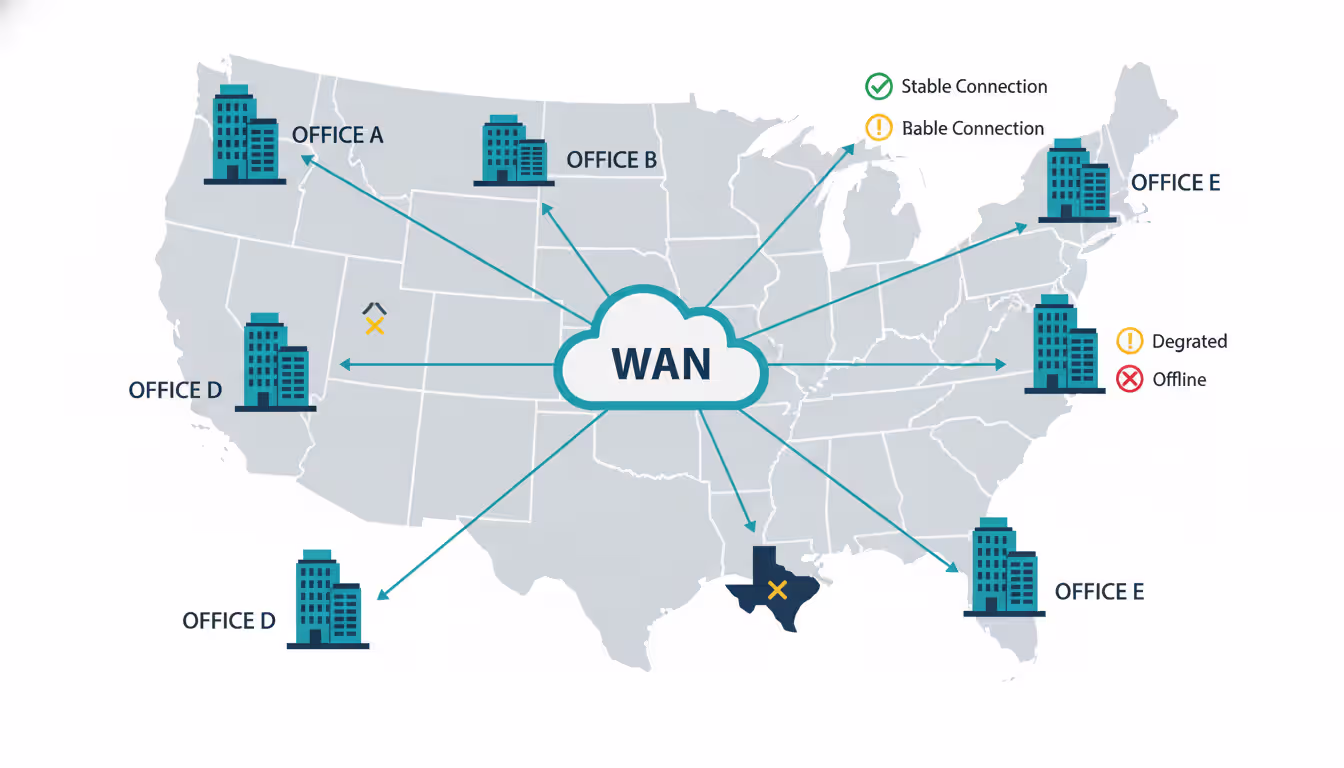
Wide area network monitoring means keeping constant tabs on connections between your geographically scattered locations. Think of it as the difference between checking your local office network (where everything's under your roof) and monitoring links that traverse carrier networks, public internet, and infrastructure you'll never physically touch.
Why does this distinction matter? Your local network operates in a controlled bubble. Latency measures in microseconds. You know every switch and cable. But a wide area network wan connecting your Phoenix and Boston offices? That traffic might hop through a dozen carrier routers, share bandwidth with hundreds of other customers, and face routing changes that happen without warning at 3 AM.
The metrics you'll track tell different stories. Latency shows how long packets take to travel between sites—critical because even a 200-millisecond delay turns snappy applications into frustrating ones. Packet loss means dropped data that needs retransmitting, killing throughput and making users wait. Jitter (those annoying variations in packet timing) wrecks video calls and VoIP quality. And bandwidth utilization? That's your early warning that you're about to hit capacity limits.
Let's talk real consequences. A retail chain with 75 stores loses actual revenue when their point-of-sale systems slow down because headquarters connectivity degrades. We're talking abandoned transactions and angry customers. A manufacturer watches production lines stall when remote plants can't sync inventory data with central systems. Healthcare providers? They face potential HIPAA violations when medical imaging transfers between facilities miss regulatory timeframes.
Picture a regional bank with 40 branches. Without proper monitoring, their network team only learns about problems when phones start ringing—usually after employees have suffered through hours of degraded performance. By then, you're doing forensic analysis through logs, trying to piece together what happened. With monitoring? You spot a branch circuit hitting 85% utilization during backup windows and fix it before anyone notices.
Author: Trevor Langford;
Source: milkandchocolate.net
How Wide Area Network Monitoring Works
Everything starts with discovery—mapping out every router, switch, firewall, and circuit connecting your locations. Modern platforms crawl your network automatically, building a picture of how everything connects. This isn't a one-time snapshot either. Good systems continuously update as you add devices or retire old equipment.
That wide area network diagram you generate becomes surprisingly valuable. Your network team references it during 2 AM troubleshooting calls. Management finally understands where their infrastructure dollars went. Security folks identify potential weak points. The diagram evolves with your network, showing reality rather than some outdated Visio file buried in a shared drive.
Now for data collection—you've got options, each with tradeoffs. SNMP (Simple Network Management Protocol) queries your devices for statistics: interface counters, CPU usage, error rates. It's lightweight and scales well, but only shows you device-level details.
NetFlow and its cousins (sFlow, IPFIX) export metadata about traffic flows. You'll see which applications consume bandwidth, source and destination pairs, protocol breakdowns. One manufacturing client discovered their automated backups from remote facilities were saturating circuits at 2 PM daily—right during peak business hours. Moved those backups to midnight and problems vanished.
Packet capture gives you the full story by recording actual traffic. But it's resource-intensive, so you'll typically use it for targeted troubleshooting. When that custom application performs poorly over a specific WAN link, packet captures reveal whether the network's dropping packets or the application's just chatty and inefficient.
Real-time analysis catches immediate problems: circuit failures, sudden latency spikes, weird traffic patterns suggesting security issues. Historical analysis spots trends you'd otherwise miss. Maybe bandwidth grows 5% monthly. Or performance degrades every Tuesday at 10 AM. Or remote offices show seasonal patterns around inventory cycles.
Alert mechanisms range from simple to sophisticated. Basic threshold alerts trigger when latency exceeds 100ms. Smarter systems learn your normal patterns and flag deviations—recognizing that 60ms at 2 AM represents trouble even though it's below your threshold, because you typically see 15ms at that hour.
Common WAN Performance Issues and Detection Methods
Bandwidth congestion hits remote sites hard. A branch office might cruise along fine on their 50 Mbps connection for months. Then someone schedules an all-hands video meeting while three people run large file uploads and automated backups kick in. Suddenly everyone's complaining. Monitoring bandwidth utilization shows you're approaching limits before users feel the pain.
Application performance tells a different story across WAN links versus local networks. That application responding instantly in headquarters? It might become unusably slow when accessed from remote locations. High latency amplifies problems with chatty protocols requiring multiple round-trips. You'll want to monitor application response times from various locations to isolate whether issues stem from the app itself, WAN transport, or remote site infrastructure.
Security threats targeting WAN connections include the usual suspects: unauthorized access attempts, data exfiltration, DDoS attacks. Watch for unusual patterns—sudden outbound data spikes from a remote office, connections to suspicious destinations, protocol anomalies. Without monitoring, these activities continue undetected until damage is done.
Circuit failures test whether your redundancy actually works. You've paid for backup circuits expecting automatic failover when primary links fail. Monitoring verifies failover happens correctly and measures recovery time. One insurance company discovered their "redundant" circuits from different carriers actually shared the same physical conduit for the last mile—meaning a construction crew could knock out both simultaneously.
Performance Issue
Primary Metric
Secondary Indicators
Typical Threshold
Bandwidth congestion
Circuit utilization
Packet loss climbing, latency increasing
Sustained above 80% for 5+ minutes
Application slowdowns
Transaction response time
TCP retransmissions, reduced window sizes
Response time doubles versus baseline
Security incidents
Traffic volume anomalies
Unusual port activity, unfamiliar destinations
3+ standard deviations from normal patterns
Circuit outages
Link status changes
Failover events logged, routing table changes
Immediate notification on status change
Poor VoIP quality
Jitter measurements
MOS scores dropping, packet loss rising
Jitter exceeding 30ms, loss above 1%
DNS problems
Query response delays
Failed queries accumulating, timeouts increasing
Responses over 500ms, failure rate above 5%
Choosing WAN Monitoring Tools and Providers
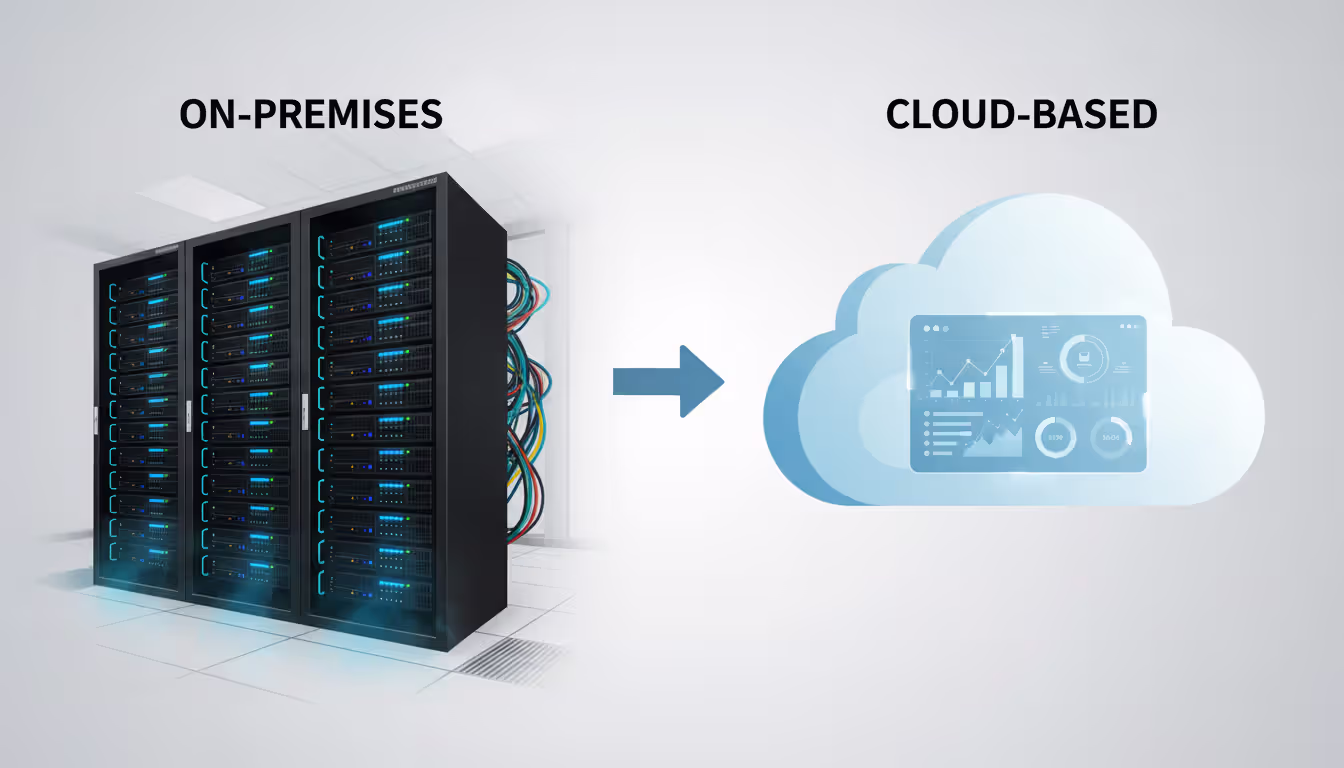
You'll face a basic fork in the road: on-premises monitoring platforms or cloud-based solutions. On-premises tools keep all your data under your control and work even when internet connectivity fails (ironically important when monitoring the infrastructure providing that connectivity). The downsides? Upfront hardware costs, ongoing maintenance, and you'll need expertise in-house.
Cloud-based platforms eliminate infrastructure management headaches. Access your dashboards from anywhere. But you're depending on external services and introducing another potential failure point. Many organizations split the difference—deploying lightweight collectors at each location that forward data to cloud analytics. You get local resilience with centralized management.
Integration with your network architecture matters more than you'd think. Traditional MPLS networks from carriers provide consistent performance but limited visibility into what happens inside their infrastructure. Wide area networking services built on SD-WAN offer application-aware routing and detailed telemetry, but they're more complex to monitor. The best platforms handle both, recognizing most enterprises run hybrid environments during multi-year transitions.
Vendor capabilities span a wide range. Entry-level tools handle basic uptime checks and bandwidth graphs. Mid-tier platforms add application performance monitoring and traffic analysis. Enterprise solutions throw in predictive analytics, automated remediation, and integration with your broader IT management stack.
Author: Trevor Langford;
Source: milkandchocolate.net
Cost factors extend beyond the license fees on the quote. Per-device licensing gets expensive fast as your network grows. Unlimited device options cost more upfront but scale better economically. Cloud platforms typically charge based on data volume or monitored endpoints. Calculate total cost including deployment time, training, ongoing support, and the inevitable scope expansion when teams see the value and want more.
Questions to Ask Wide Area Network Providers
When you're evaluating wide area network providers, dig past the glossy sales materials. Ask how they monitor their own infrastructure and what visibility they'll give you into your specific circuits. Some carriers provide basic uptime statistics ("your circuit was up 99.9% last month!"). Others grant access to detailed performance metrics for your actual links.
Push them on mean time to repair for circuit failures. Do their SLAs include performance guarantees beyond simple availability? A circuit that's technically "up" but experiencing 40% packet loss doesn't meet anyone's definition of working. Understand their escalation procedures and whether they proactively monitor or just react when you call screaming.
Ask about planned maintenance. How much notice do you get? Carriers performing maintenance on shared infrastructure affect multiple customers, but notification practices vary wildly. Some provide 48-hour advance warnings. Others send a same-day email. Find out if you can integrate carrier-provided metrics into your own monitoring platform.
Author: Trevor Langford;
Source: milkandchocolate.net
Best Practices for Implementing WAN Monitoring
Start by establishing baseline performance metrics during normal operations. You need this reference point to spot abnormal conditions. Collect data when things are working well to understand typical latency ranges, usual bandwidth consumption patterns, expected application response times. Don't baseline during year-end holidays when half your staff is out—that won't represent normal business activity.
Baselines aren't set-it-and-forget-it. Business conditions change. You add new applications, shift workloads to cloud services, open additional locations. Traffic patterns evolve. Review and refresh your baselines quarterly or after significant infrastructure changes. Last year's "normal" might be this year's problem indicator.
Effective network diagrams serve multiple audiences. Logical diagrams show traffic flows and dependencies between locations—great for troubleshooting. Physical diagrams detail actual equipment and circuit connections—essential for planning. Maintain both views as your wide area network design evolves. Automated discovery generates initial diagrams, but you'll need human review to ensure accuracy and add business context that tools can't infer.
Configure alerts that prevent issues from escalating into outages. Alert at 70% bandwidth utilization—giving you time to plan capacity upgrades before hitting 90% and watching performance tank. Layer alerts with escalating severity: warnings for potential issues, critical alerts for immediate problems requiring action.
Here's the tricky part: avoiding alert fatigue. An alert firing 50 times daily becomes noise. Teams start ignoring notifications, potentially missing genuine problems buried in the spam. Start conservative with higher thresholds, then tune based on actual operational impact and false positive rates.
Monitoring hybrid and multi-cloud environments demands consistent visibility wherever workloads run. Traffic from branch offices to your data center follows different paths than traffic headed to AWS or Azure. Ensure monitoring coverage extends to cloud provider connections. Measure performance from the user perspective, not just to the cloud edge.
Organizations implementing comprehensive WAN monitoring cut mean time to resolution by 60% compared to reactive troubleshooting.The ROI shows up the first time you prevent a major incident instead of fighting fires. I've watched companies avoid six-figure revenue losses because monitoring caught circuit degradation overnight, enabling repairs before business opened
— Marcus Chen
Document who does what when alerts fire. Who gets paged during business hours versus at 3 AM? What authority do responders have to make changes? How quickly should different severity levels get attention? Iron out these operational details before incidents happen.
Connect monitoring data with your change management process. Correlating performance changes with configuration modifications, software updates, or circuit upgrades reveals cause-and-effect relationships. When latency jumps after a router firmware update, that correlation focuses troubleshooting immediately.
Frequently Asked Questions About WAN Monitoring
What's the difference between WAN monitoring and WAN optimization?
Monitoring watches and reports on network conditions without changing how traffic flows. Optimization actively modifies traffic through compression, caching, protocol acceleration, and traffic shaping to squeeze better performance from existing bandwidth. Effective optimization depends on monitoring data to identify which applications and locations need help most. Most organizations implement monitoring first to understand their baseline, then deploy optimization where analysis shows the biggest potential gains.
How often should WAN performance be reviewed?
Real-time monitoring runs constantly, but human review cadence depends on your role. Network ops teams check dashboards several times daily, investigating alerts and verifying normal operations. Weekly reviews catch emerging trends—gradual bandwidth growth, recurring performance patterns, seasonal variations. Monthly or quarterly business reviews examine performance against service level objectives and drive capacity planning decisions. Executive summaries might happen quarterly, focusing on business impact rather than technical minutiae.
Can WAN monitoring help with compliance requirements?
Absolutely, especially for regulations demanding data protection controls and audit trails. Monitoring detects unauthorized data transfers, documents network security events, and provides evidence of infrastructure reliability. Healthcare organizations use monitoring data demonstrating HIPAA-compliant network security. Financial institutions reference monitoring logs during audits verifying transaction processing capabilities and disaster recovery readiness. But monitoring alone doesn't guarantee compliance—it provides visibility supporting broader compliance programs.
What are the typical costs for enterprise WAN monitoring?
Costs vary dramatically depending on scale and sophistication. Small businesses might spend $2,000–$5,000 yearly for cloud-based monitoring covering 5–10 sites. Mid-sized enterprises with 25–50 locations typically invest $15,000–$40,000 annually for comprehensive monitoring including application performance visibility. Large organizations with hundreds of sites often spend $100,000+ yearly on enterprise platforms. This represents a fraction of total WAN infrastructure costs. Calculate ROI based on prevented downtime rather than comparing monitoring costs to circuit expenses.
Do I need different tools for SD-WAN vs. traditional WAN?
Not necessarily, but capabilities matter more with SD-WAN. Traditional WANs using MPLS circuits require monitoring basic metrics: availability, bandwidth, latency, packet loss. SD-WAN introduces layers of complexity—multiple transport types, dynamic path selection, application-aware routing policies, overlay and underlay relationships. The best platforms monitor both traditional and SD-WAN architectures in a single interface. Most networks include both during transitions spanning multiple years anyway.
How does WAN monitoring integrate with existing IT management systems?
Modern monitoring platforms offer APIs, webhooks, and pre-built integrations with ticketing systems, configuration management databases, and IT service management platforms. When monitoring detects a WAN issue, it automatically creates tickets in ServiceNow or Jira, populates them with relevant diagnostic data, and assigns them based on your rules. Integration with CMDBs correlates network events with affected business services—showing that a circuit failure impacts specific applications and user groups. Bi-directional integration lets orchestration platforms query monitoring systems before making changes, verifying current network health first.
Effective wide area network monitoring transforms how you maintain connectivity across distributed locations. Instead of reacting to user complaints after performance tanks, you'll spot emerging issues while time remains to address them methodically. The investment in monitoring tools and processes returns dividends through reduced downtime, faster problem resolution, and data-driven capacity planning.
Success requires more than buying monitoring software. Establish meaningful baselines. Tune alerts to catch genuine problems while minimizing noise. Integrate monitoring data into operational workflows. Review performance trends regularly to identify patterns requiring attention before they impact business operations.
Networks continue evolving toward SD-WAN architectures and cloud-centric designs. This evolution brings flexibility but increases monitoring complexity. Organizations building comprehensive visibility into their wide area networks can leverage new capabilities confidently while maintaining the reliability their operations demand.
Zero trust VPN fundamentally changes remote access security by continuously verifying identity and device posture before granting application-level access. Unlike traditional VPNs that trust authenticated users across entire networks, zero trust solutions enforce micro-segmentation and never assume trust
WiFi 6E adds 59 channels in the 6 GHz band, providing clean spectrum for high-speed connections. Learn how channel allocation works, real-world speed differences versus WiFi 6, tri-band operation, and whether the technology justifies the cost premium for your specific environment
Web based and cloud based systems differ fundamentally in infrastructure, scalability, and costs. Web based systems run on fixed servers with predictable expenses, while cloud platforms offer elastic scaling with usage-based pricing. Learn which architecture fits your monitoring, remote access, or enterprise needs
Remote file transfers are essential for distributed work. This comprehensive guide covers practical methods from Windows RDP to network shares and SSH protocols, with step-by-step instructions, troubleshooting tips, and security practices that protect your data during transit
The content on this website is provided for general informational purposes only. It is intended to offer insights, commentary, and analysis on cloud computing, network infrastructure, cybersecurity, and IT solutions, and should not be considered professional, technical, or legal advice.
All information, articles, and materials presented on this website are for general informational purposes only. Technologies, standards, and best practices may vary depending on specific environments and may change over time. The application of any technical concepts depends on individual systems, configurations, and requirements.
This website is not responsible for any errors or omissions in the content, or for any actions taken based on the information provided. Users are encouraged to seek qualified professional advice tailored to their specific IT infrastructure, security, and business needs before making decisions.