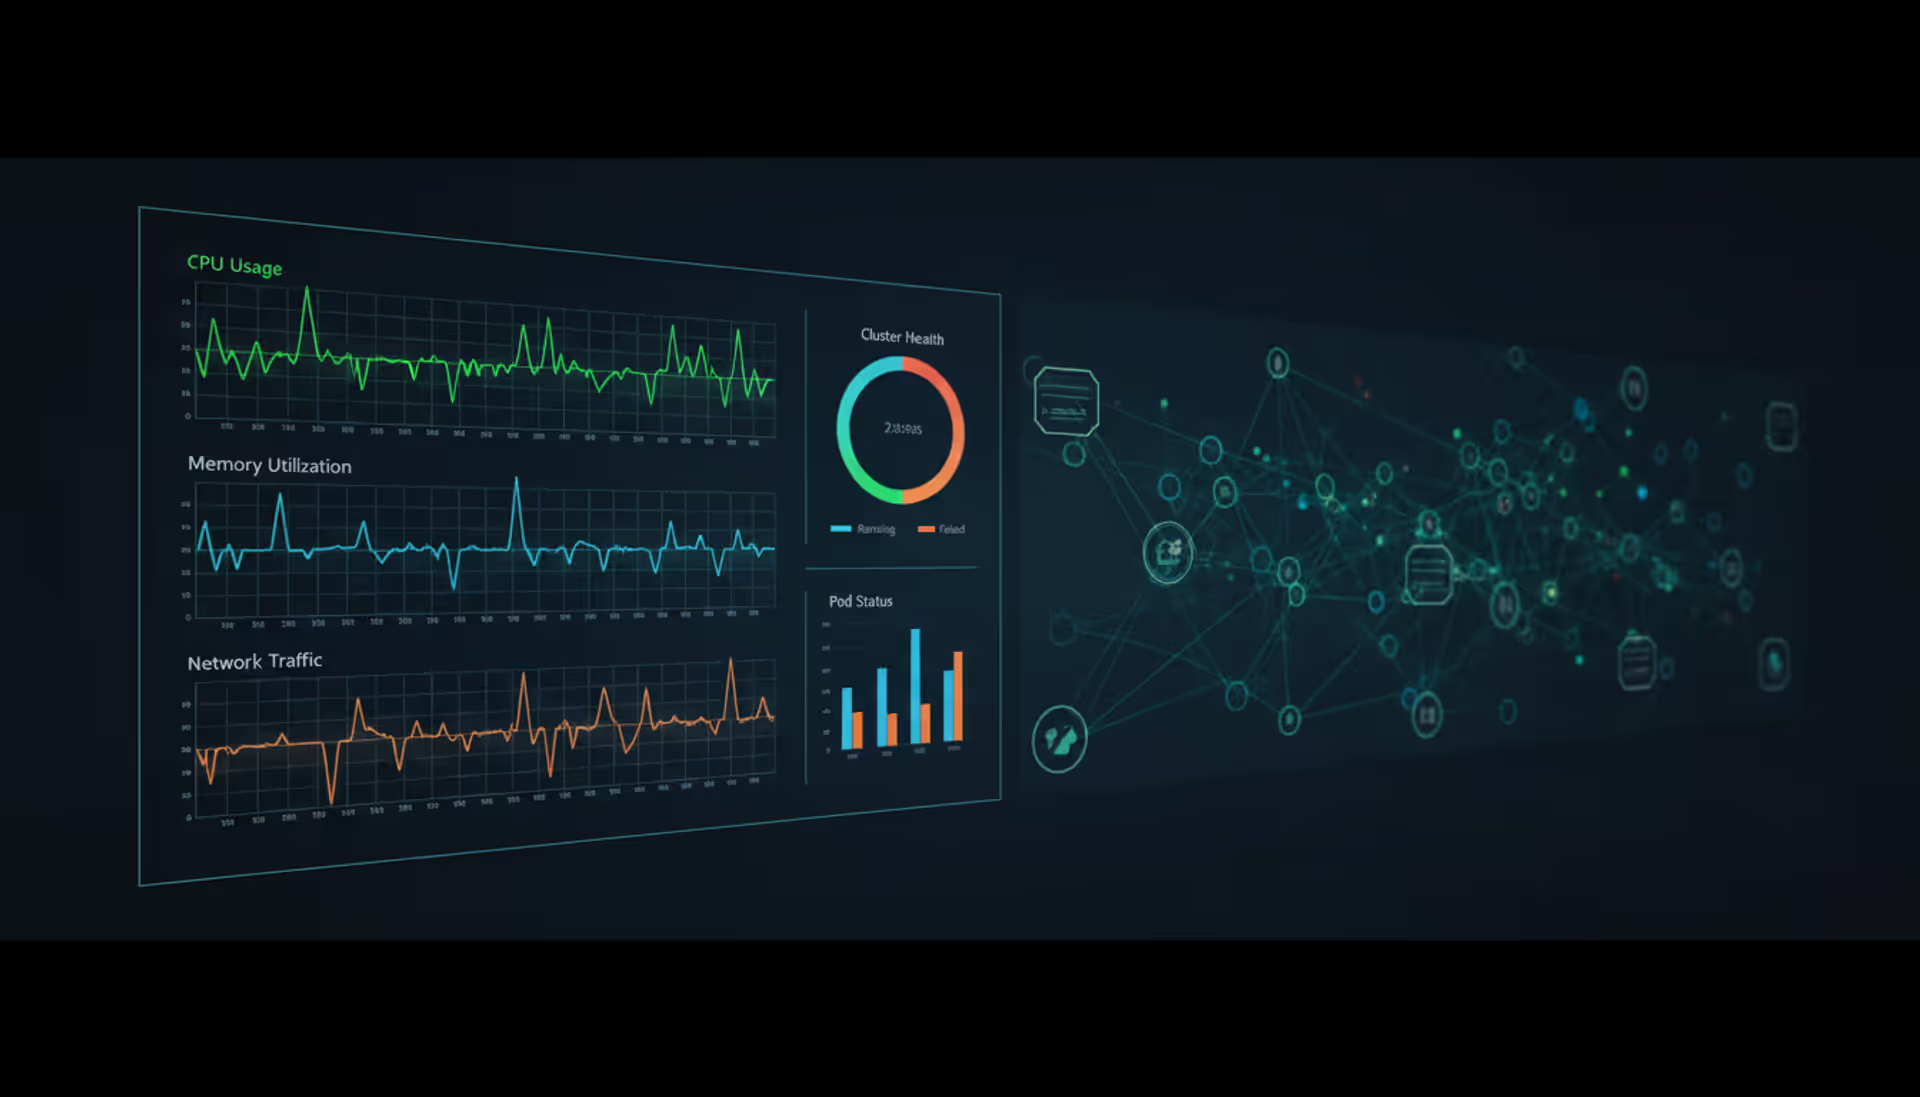
Dark monitoring dashboard showing Kubernetes cluster performance metrics with CPU, memory, and network graphs overlaid on a schematic node-and-pod network visualization
You're tracking performance data across your entire container orchestration platform—that's Kubernetes cluster monitoring in a nutshell. But here's the thing: you can't just point traditional server monitoring tools at K8s and call it done.
Why? Containers appear and vanish in seconds. Pods get rescheduled constantly. What worked for monitoring static VMs completely breaks down when workloads bounce between nodes every few minutes.
Three types of data actually matter here. Infrastructure health metrics—CPU consumption, memory allocation, disk I/O patterns across your nodes. Application performance signals like request latency, error percentages, and throughput rates. Then you've got Kubernetes-specific indicators: how often pods restart, scheduling failures, resource quota breaches.
Here's a real example. This manufacturing outfit ran inventory systems that mysteriously dragged every Tuesday around 2 PM. Order processing tanked by 40%. The dev team initially suspected buggy application code—spent three weeks combing through it. Finally someone checked the metrics. Turns out node memory pressure was triggering pod evictions right when their weekly backup jobs ran. The pods and backup window collided, but you'd never see that in application logs. Monitoring changed their approach from guessing to actually knowing what was broken.
Now, collecting metrics isn't the hard part. A 10-node cluster running 200 pods spits out roughly 50,000 metric data points every 15 seconds. That's 200,000+ per minute. The real challenge? Filtering signal from noise. You need enough granularity to catch issues before customers start complaining, but not so much data that everything becomes meaningless background noise.
Containers fail quietly. Resource contention creates cascading problems across services. Troubleshooting without telemetry? You're basically trying to navigate downtown Chicago with no street signs and a blindfold on.
Author: Nicole Bramwell;
Source: milkandchocolate.net
Kubernetes Cluster Architecture and Monitoring Points
You need to understand where monitoring hooks into your cluster. Kubernetes splits responsibilities between the control plane (managing everything) and the data plane (running actual workloads). Each layer fails differently.
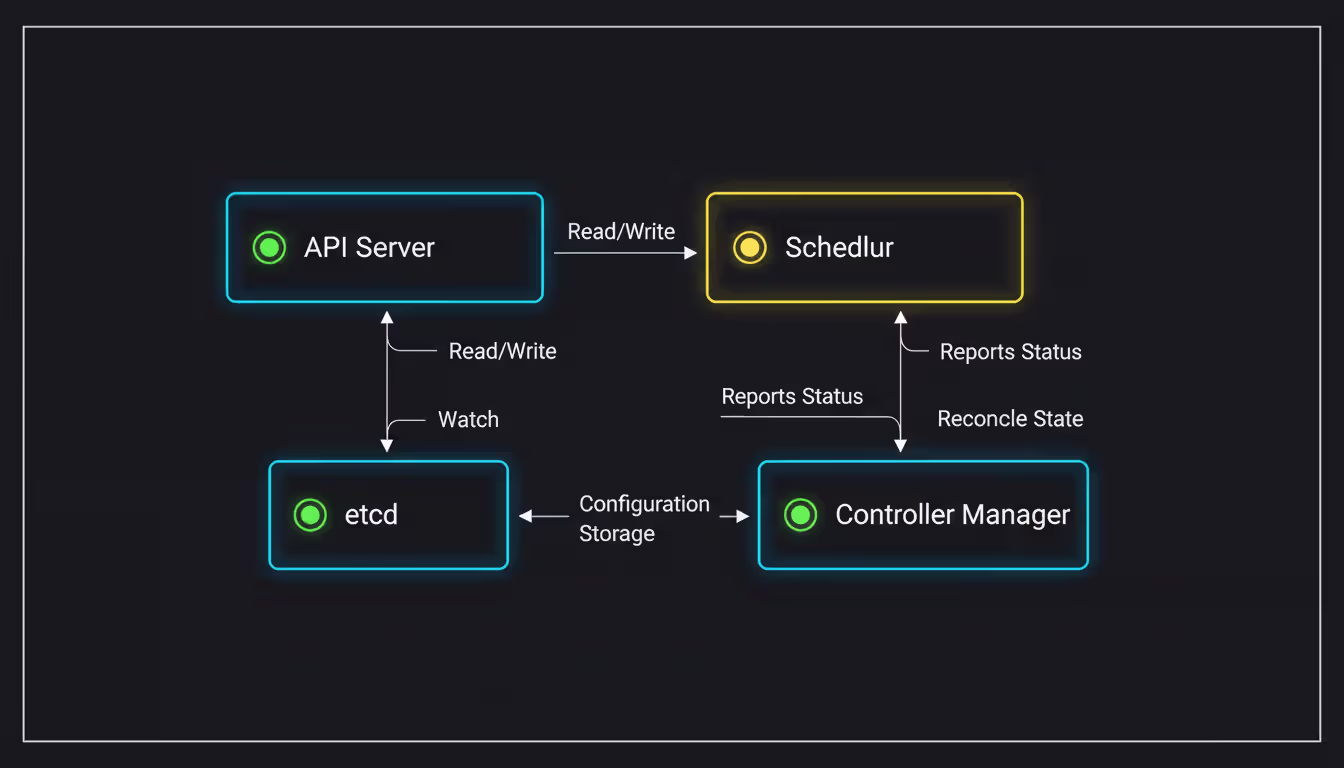
Control Plane Monitoring
Your control plane includes the API server, etcd database, scheduler, and controller manager. The API server metrics expose request latency, authentication failures, and webhook timeout rates. One financial services team noticed their P99 latency jumping from 200ms to 8 seconds during deployments. Turned out admission webhooks were timing out when validating 500+ pod specifications at once.
Etcd deserves special attention. This distributed key-value store holds your entire cluster state—every pod, service, config map, secret. Watch etcd disk sync duration (should stay under 10ms). Monitor leader election changes—frequent changes mean instability. Track database size growth. If you exceed etcd's 8GB default quota, the cluster refuses all write operations. Deployments freeze. Scaling stops working. Everything locks up.
Scheduler metrics reveal how long pods stay pending and how often scheduling attempts happen. Pods pending beyond 30 seconds? You're either running out of resources or fighting affinity rules that prevent placement.
Controller manager metrics track reconciliation loop duration. How long does it take to reach your desired state after you make changes? Long durations indicate controller problems.
Author: Nicole Bramwell;
Source: milkandchocolate.net
Node and Pod-Level Metrics
Each node's kubelet process exposes resource consumption data through an HTTP endpoint that Prometheus can scrape. You're looking at CPU utilization, memory pressure, disk I/O wait times, and network throughput patterns.
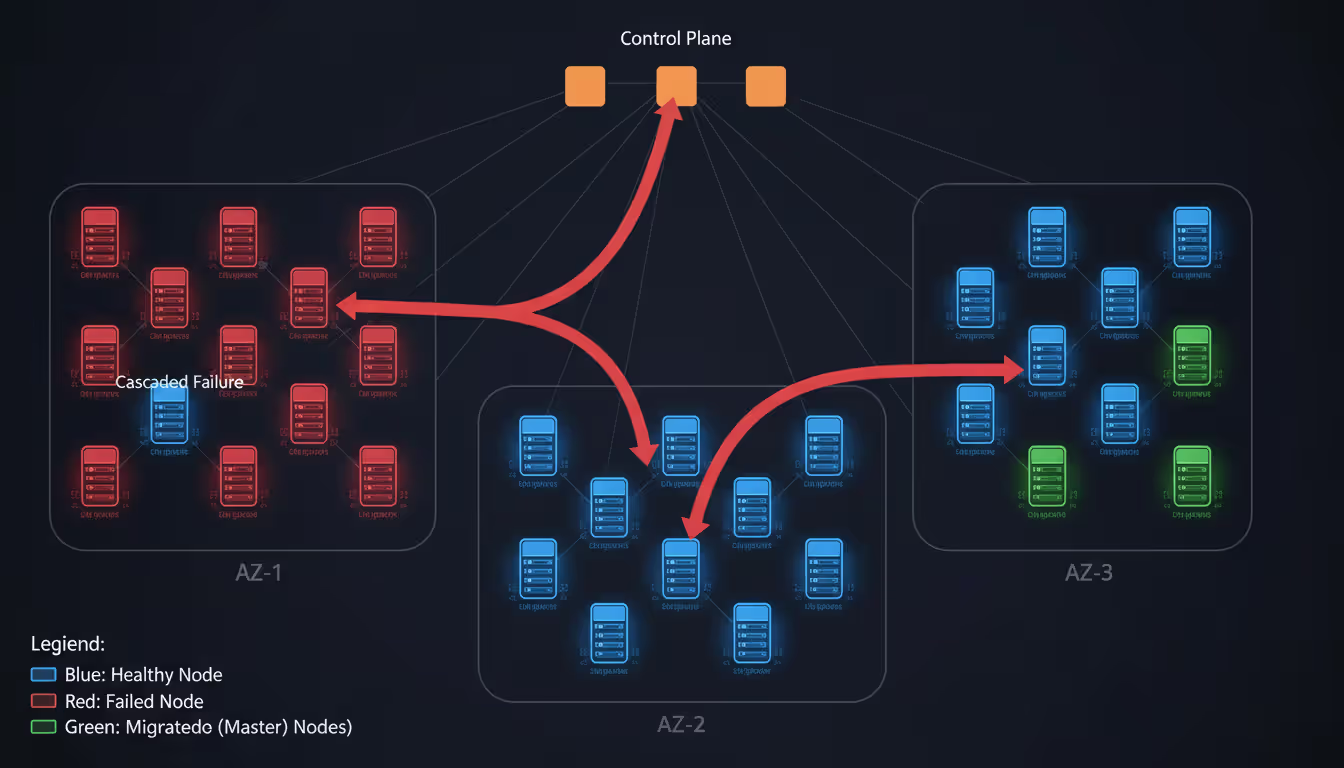
Watch for memory pressure conditions carefully. Kubernetes starts killing pods when nodes hit 85% memory usage by default. These evictions cascade—killed pods reschedule to other nodes, increasing pressure there, triggering more evictions.
Pod-level metrics include container restart counts. Frequent restarts mean crashloop backoffs—your app keeps dying and Kubernetes keeps restarting it with exponential delays. Also track resource throttling events. See how actual resource usage compares to requested amounts. Common mistake: setting CPU requests too low causes throttling under load. Setting them too high wastes cluster capacity. You need weeks of actual usage data to right-size these.
Container metrics drill into individual application performance. Heap memory usage, garbage collection pauses, thread counts, custom metrics your application exports. Network metrics between pods reveal microservice communication bottlenecks. This e-commerce platform found their checkout service spent 60% of request time waiting on an internal DNS resolver that was completely misconfigured.
Essential Metrics to Track in Your Cluster
Start with the USE method—Utilization, Saturation, Errors. For Kubernetes specifically, here's what actually matters.
Resource utilization tracking: Monitor node CPU and memory against allocatable capacity, not total capacity. Allocatable excludes resources reserved for system daemons like kubelet and container runtime. Alert when nodes consistently exceed 80% CPU or 85% memory. You need headroom for rescheduling pods when nodes fail. Disk utilization matters too—pods writing logs to disk can fill root partitions and crash entire nodes.
Application performance indicators: Request rate, error rate, duration. The RED method. Measure these at ingress controllers for external traffic and between microservices for internal traffic. Percentile latencies (P50, P95, P99) reveal actual user experience. P99 latency of 5 seconds means 1% of users wait that long, even when average latency looks fine at 200ms.
Cluster health signals: Pod restart counts exceeding 3 in 10 minutes indicate application instability or resource starvation. Pending pods suggest exhausted resources or scheduling constraints. Failed scheduling attempts point to taints, tolerations, or affinity rules blocking placement. Node NotReady status requires immediate attention—worker nodes should maintain Ready status 99.9% of the time.
Custom application metrics: Export business-relevant indicators. Orders processed per minute, authentication success rates, database connection pool utilization. These connect technical metrics to business impact. During Black Friday, this retailer's monitoring showed pod CPU at 60%—totally healthy. But orders-per-minute dropped 30%. Why? Database connection pool was exhausted. Infrastructure metrics looked fine but the business was bleeding money.
Skip vanity metrics. Total pod count across the cluster sounds useful but rarely informs decisions. Focus on metrics answering "Is my application healthy?" and "Do I need to scale right now?"
Kubernetes Cluster Monitoring Tools Comparison
The K8s monitoring ecosystem ranges from lightweight open-source projects to comprehensive commercial platforms. Your choice depends on team expertise, budget, and how mature your observability practices are.
Teams focused on application performance management
Elastic Stack
Complex (multiple components)
Free self-hosted or managed ($95+/month)
Logs, metrics, traces combined
Query-based alerting via Watcher
Steep (Elasticsearch knowledge essential)
Workloads generating massive log volumes
Metrics Server
Trivial (often pre-installed)
Free
Basic resource metrics only
None (just a data provider)
Minimal
HPA autoscaling and kubectl top functionality
Prometheus became the standard for K8s monitoring. It scrapes metrics from instrumented endpoints, stores time-series data locally, integrates natively with Kubernetes service discovery. Grafana handles visualization dashboards. This stack means managing your own storage, retention policies, and high availability. Expect to dedicate engineering hours to maintenance.
Datadog and New Relic offer turnkey solutions. Automatic Kubernetes discovery, pre-built dashboards, integrated alerting. They excel at correlating data across infrastructure, applications, and logs. The trade-off: monthly costs scale with cluster size. You're locked into their platforms.
Metrics Server deserves mention as Kubernetes' lightweight metrics API. It powers horizontal pod autoscaling and kubectl top commands. Only stores the latest metric values—no historical data. Unsuitable for troubleshooting but perfect for real-time autoscaling decisions.
A mid-sized SaaS company running 5 clusters with 50 total nodes might spend $2,000 monthly on Datadog or $800 monthly on managed Prometheus through cloud providers. Self-hosting Prometheus costs around $500 monthly in infrastructure. Hidden cost of self-hosting: 10-15 hours monthly maintaining the monitoring stack itself.
Setting Up Monitoring for Your Kubernetes Cluster
Implementing monitoring follows a consistent pattern regardless of which tools you choose. Deploy collectors, configure scraping targets, build dashboards, define alerts.
Prerequisites check: Verify your cluster version supports the Metrics API (Kubernetes 1.8 or newer). Confirm nodes have sufficient spare resources—monitoring infrastructure typically consumes 5-10% of cluster capacity. Allocate at least 2GB memory and 1 CPU core for Prometheus per 100 monitored pods.
Deploying the stack: Using Prometheus as our example, the kube-prometheus-stack Helm chart bundles Prometheus, Grafana, and pre-configured alerts together. Deploy it like this:
This command deploys Prometheus with persistent storage, Grafana with default dashboards, and Alertmanager for routing notifications to Slack or PagerDuty.
Configuration basics: Prometheus discovers scrape targets through Kubernetes service discovery automatically. ServiceMonitors (custom resources) define which services to scrape. Here's an example for monitoring an application exposing metrics on port 8080:
Import community dashboards. Dashboard ID 315 provides Kubernetes cluster monitoring. Dashboard ID 6417 covers pod metrics. Or build custom dashboards querying your Prometheus data sources directly.
Common setup mistakes: Not setting resource limits on monitoring pods lets them consume excessive memory under load. Forgetting to configure persistent volumes means losing all historical data when pods restart. Scraping too frequently—every 5 seconds—overwhelms API servers. Thirty-second intervals work fine for most workloads.
One healthcare company spent two weeks troubleshooting "missing metrics." Their network policies blocked Prometheus from reaching pod metric endpoints. Always verify network connectivity between your monitoring namespace and target workloads.
Author: Nicole Bramwell;
Source: milkandchocolate.net
Monitoring Best Practices and Common Mistakes
Effective Kubernetes monitoring balances comprehensiveness with maintainability. You want visibility without drowning in data.
Alerting strategies: Alert on symptoms users experience, not internal component states. "API response time exceeds 500ms" matters more than "Pod CPU usage above 80%." High CPU might be completely normal for your workload under expected load patterns. Implement tiered alerts. Page engineers for production-down scenarios. Send Slack notifications for warnings. Log informational events without human notification.
Define your alert fatigue threshold. If your team receives more than 10 alerts daily, you're alerting on noise. One operations team reduced alerts from 50 to 8 per day by switching from static thresholds to dynamic baselines. They started alerting when metrics deviated 2 standard deviations from historical patterns instead of crossing arbitrary fixed values.
Retention policies: Balance historical data value against storage costs. Keep high-resolution metrics (15-second intervals) for 7 days. Downsample to 5-minute intervals and retain for 90 days. Store monthly aggregates for 2 years. Prometheus supports remote write to long-term storage like Thanos or Cortex for extended retention without bloating local storage.
Avoiding blind spots: Monitor your monitoring system itself. Set up external health checks pinging Prometheus and Grafana endpoints. Use dead man's switch alerts that fire continuously when everything's healthy—silence indicates monitoring failure. Track metric scrape success rates. A sudden drop means service discovery broke or targets became unreachable.
Label cardinality kills Prometheus performance. Avoid high-cardinality labels like user IDs or request IDs in your metrics. Prometheus creates a new time series for each unique label combination. One team crashed their Prometheus instance by including customer email addresses as labels. This created 2 million time series and exhausted memory.
Performance impact considerations: Monitoring consumes real resources. Scraping 1,000 endpoints every 15 seconds generates 240,000 HTTP requests per hour. Limit scrape intervals appropriately. Cluster-level metrics every 60 seconds. Application metrics every 30 seconds. Critical service metrics every 15 seconds.
Observability isn't about collecting all possible data—it's about collecting the right data to answer questions you haven't thought to ask yet. In Kubernetes, that means instrumenting for unknown unknowns, because distributed systems fail in creative ways
— Kelsey Hightower
Monitoring for Disaster Recovery Readiness
Kubernetes disaster recovery depends on monitoring to validate backup integrity, detect failure patterns early, and verify recovery procedures actually work before disasters strike.
Supporting DR strategy through metrics: Track etcd backup success rates and backup file sizes. Sudden size changes indicate data corruption or incomplete backups. Monitor persistent volume snapshot creation times and success rates. This manufacturing company discovered their nightly backups silently failed for three weeks. Monitoring revealed zero successful snapshots—their backup service account lost permissions during a security audit.
Detecting failure patterns: Correlated node failures often precede larger outages. If three nodes in the same availability zone become NotReady simultaneously, suspect zone-level networking or power issues. Monitor API server certificate expiration dates. Clusters become completely inaccessible when certificates expire. This happens more often than you'd expect.
Track pod eviction rates across nodes. Spikes indicate memory pressure or disk exhaustion spreading cluster-wide. A financial services firm avoided a production outage by alerting on eviction rates exceeding 5 pods per minute. Investigation revealed a memory leak in their logging sidecar consuming 500MB every hour.
Backup validation through metrics: Test disaster recovery monthly by spinning up monitoring-only clusters from backups. Compare metric patterns between production and restored clusters. Divergence indicates incomplete restores. Monitor recovery time objectives (RTO) by measuring how long test restores actually take. One team discovered their "15-minute RTO" actually took 90 minutes because etcd restore required manual intervention nobody documented.
Set up cross-region monitoring. If your primary cluster fails completely, monitoring in another region should detect the outage and trigger DR procedures automatically. This requires exporting critical metrics to external systems. Relying solely on in-cluster monitoring creates a single point of failure.
Author: Nicole Bramwell;
Source: milkandchocolate.net
Frequently Asked Questions
What's the difference between Kubernetes monitoring and logging?
Monitoring collects numeric time-series data—CPU usage percentages, request counts, latency measurements. These metrics aggregate well and enable threshold-based alerting. Logging captures event streams like application logs, audit trails, error messages. Logs help debug specific issues after you know something's wrong. You need both working together. Monitoring tells you something broke. Logs tell you what specifically broke and why. For example, monitoring shows your API error rate jumped to 15%. Logs reveal which specific endpoints are failing and the exact error messages returned.
Do I need third-party tools or are native Kubernetes tools enough?
Native tools like Metrics Server and kubectl top provide basic resource visibility and autoscaling capabilities. That's it. Production environments require historical data, alerting rules, correlation across services—capabilities native tools completely lack. Start with Prometheus and Grafana since they're free and open-source. Consider commercial tools when monitoring complexity exceeds your team's capacity or willingness to maintain open-source stacks. Third-party platforms make sense when you'd rather pay money than spend engineering hours maintaining monitoring infrastructure.
How much does Kubernetes monitoring impact cluster performance?
Expect 5-10% overhead in CPU and memory across your entire cluster. Prometheus scraping generates network traffic—roughly 1-2KB per scrape target per interval. Storing metrics requires disk I/O operations. Impact scales with scrape frequency and metric cardinality. A 100-node cluster scraping 500 targets every 30 seconds typically uses 8-12GB memory and 2-4 CPU cores total for the entire monitoring stack. Optimize by reducing scrape frequency for non-critical metrics and limiting label cardinality aggressively.
What metrics should trigger immediate alerts?
Alert immediately on: API server unavailability (cluster becomes unmanageable), etcd cluster health failures (data loss risk), node NotReady status lasting over 5 minutes (workload disruption), persistent volume mount failures (stateful applications crash), pod crashloop backoffs exceeding 5 restarts in 10 minutes. Application-specific alerts should focus on user-facing symptoms, not internal states. Error rates above 1%. P99 latency exceeding SLA thresholds. Throughput dropping below expected baseline levels.
Can I monitor Kubernetes clusters across multiple cloud providers?
Yes, through centralized monitoring platforms or federated Prometheus setups. Deploy monitoring agents in each cluster that forward metrics to a central Prometheus instance or commercial platform like Datadog. Use consistent labeling—environment, region, cloud provider—to filter and aggregate across clusters. One challenge: networking between clouds for metric collection. Use VPN tunnels or remote write to cloud-neutral storage like S3 or GCS. Multi-cluster monitoring reveals cross-cloud performance differences and helps optimize workload placement decisions.
How long should I retain monitoring data?
Retain high-resolution data (15-30 second intervals) for 7-14 days to troubleshoot recent incidents while details are fresh. Downsample to 5-minute intervals and keep for 90 days for trend analysis and capacity planning. Store monthly aggregates for 1-2 years to analyze seasonal patterns and support compliance audits. Adjust based on your actual troubleshooting patterns. If you frequently investigate issues from 30+ days ago, extend retention accordingly. Storage costs typically run $0.10-0.30 per GB monthly for cloud block storage. A cluster generating 50GB metrics monthly costs $5-15 for 90-day retention.
Monitoring Kubernetes clusters transforms operational guesswork into data-driven decision making. Start with infrastructure basics—node health, resource utilization, pod status. Layer in application performance metrics and business-relevant indicators gradually.
Choose monitoring tools matching your team's expertise and budget. Open-source solutions require maintenance time. Commercial platforms trade flexibility for convenience. Neither choice is inherently better—it depends on your specific situation.
Implement monitoring early, ideally during initial cluster setup rather than after production issues surface. Focus alerting on user-facing symptoms requiring action, not internal metrics creating noise. Test your monitoring by simulating failures. Kill pods intentionally. Drain nodes during business hours. Saturate network links. Verify alerts fire appropriately.
Remember that monitoring supports good engineering practices but doesn't replace them. Metrics reveal problems. Fixing them requires understanding Kubernetes architecture, application behavior, infrastructure constraints. Invest time interpreting your metrics. Tune alert thresholds based on real incidents. Continuously refine what you measure as your platform evolves.
The most reliable clusters aren't those collecting the most metrics. They're the ones where teams act decisively on the right signals at the right time.
Ethernet remains the backbone of reliable network connectivity in homes, offices, and data centers. This guide explains how wired connections work, compares Ethernet vs WiFi performance, covers cable types and speeds, and provides practical troubleshooting advice for common connection problems
Out-of-band management provides independent administrative access to critical infrastructure when primary networks fail. This guide covers implementation strategies, technology options, security considerations, and best practices for deploying reliable out-of-band access across distributed IT environments
Network segmentation divides networks into isolated zones with controlled access, limiting lateral movement during breaches. This guide covers implementation strategies, tools comparison, design approaches, and common mistakes to help organizations improve security and performance through proper segmentation
Network discovery automates the process of identifying and cataloging devices connected to your infrastructure. This guide covers discovery methods, compares leading tools, and provides practical solutions to common challenges IT teams face when implementing network visibility
The content on this website is provided for general informational purposes only. It is intended to offer insights, commentary, and analysis on cloud computing, network infrastructure, cybersecurity, and IT solutions, and should not be considered professional, technical, or legal advice.
All information, articles, and materials presented on this website are for general informational purposes only. Technologies, standards, and best practices may vary depending on specific environments and may change over time. The application of any technical concepts depends on individual systems, configurations, and requirements.
This website is not responsible for any errors or omissions in the content, or for any actions taken based on the information provided. Users are encouraged to seek qualified professional advice tailored to their specific IT infrastructure, security, and business needs before making decisions.